Perform Pro 1500 Series Training Manual
Page 1 - Perform Pro 1500 Series Training Manual
Perform Pro
Training Manual
1500 Series - March 2019
Table of Contents
**Click on a topic below to jump to that section
Power On
Turn on: Green switch – powers computer and technology. Yellow switch – powers the tee light.
Turn on Projector: Point remote at the front of the projector and press the power button.
On the desktop, double click or double touch the Perform Pro icon to display the Start Window and begin game play.
How to Use Perform Pro
- To start Perform Pro play, select an existing player or create a new player to take shots.
- Next, select an existing club or create a new club to take shots with.
- Take shots and then view various shot data at any of the Perform Pro dashboards.
- To replay your shot, go to the Ball Flight dashboard and choose either Forward or Aerial view.
- If Flix is licensed for Perform Pro, you will be allowed to create and replay lessons and swing videos.
- For Balance plate users, view balance data at the Balance dashboard.
- To print a report for the selected player, choose Report Editor at the System menu.
Ball Flight Dashboard
Player List Menu
From the Player List menu you have the option to:
- Select an existing member on your Simulator.
- TIP: When there are a lot of members in the list, type the first few letters of your member name to jump directly to the first matching name in the list.
- Create a new Guest or online aG Data member.
- Select an existing online aG Data member on the cloud.
Player List Options
The following options are available at the Player List menu:
- New Golfer - Click to create an aG Data (online) or Guest player.
- Delete Golfer - Click to delete the selected player.
- Swing Profile - Click to increase or decrease the distance(s) of the golf ball flight for Drivers / Mid-Irons / Wedges (Default is 5,5,5).
- Edit - Click to edit information for an aG Data (online) player.
Player List Menu
Select an existing member
From any Perform Pro dashboard, follow these steps to select an existing player:
- At the top left of any dashboard screen, click on the member name or cap icon.
- The Player List menu will be displayed.
- To find the member you wish to select for your session:
- Use the scroll bar at the left of the list.
- Use the up/down arrow keys to scroll and find your member.
- Enter the first few characters of your member name to go directly to your member in the list.
- Double click on the player name or click the Select button next to the player name.
- The player selected will display at the top left and is ready to take shots.
- If your member is an online aG Data member:
- A world with a line through it will display next to your member name in the members list.
- After logging in your member, a world icon will display indicating your member is logged in.
- Shot, swing video and balance data will be uploaded to your online locker at the aG Data website when your online member is logged in and Upload = AUTO.
- If your online member has data that was not previously uploaded to aG Data, you will be asked if you wish to upload your data when logging in your member.
- You may also be prompted to enter a password when logging in your online member. To avoid entering a password for future logins:
- Be sure your online member is logged in
- Choose Edit
- Check the Remember Password? option
- Click OK to save your changes
- When selecting your member in the future, they will automatically be logged in -- you will no longer be prompted for a password.
- Note: You must be connected to the internet to login an aG Data member.
Player List Menu
Create a new player
- At the top left of any dashboard screen, click on the player name or cap icon.
- The Player List menu will be displayed.
- Click on the New Golfer button.
- Enter a name for the new player and click OK.
- If the member name does not exist, you will have the option to create either an aG Data or Guest player.
- A Guest member is an offline member. No data for this member will be uploaded to aG Data.
- An aG Data member is an online member. When creating a new aG Data member:
- Complete the password, confirm password and email fields.
- Data will be uploaded to the aG Data website when your online member is logged in and Upload = AUTO.
- Note: You must be connected to the internet to create or login an aG Data member.
- After creating your new member, double click on the member name or click the Select button to choose them for play.
Select a member on the cloud
- At the top left of any dashboard screen, click on the player name or cap icon.
- The Player List menu will be displayed.
- Click on the New Golfer button.
- Enter the name of your member that exists on the cloud. All members that exist on the cloud are online aG Data members.
- If prompted, enter your member password.
Select Existing Club
Select a club for play
- At the top of any dashboard screen, next to the player name, click on the club name or club icon.
- The Club List menu will be displayed.
- Find the club you wish to select and double click on the club name or choose the Select button next to the club name.
- The club selected will display at the top of the screen and is ready to use.
Club List Options
The following additional options are available at the Club List menu:
- Add Club - Click to create a new club.
- Delete Club - Click to delete the selected club.
- Delete Shots - Click to delete all shots associated to the selected club.
Create a New Club
To create a new club
- At the top of any dashboard screen, click on the club name or club icon.
- The Club List menu will be displayed.
- Click on the Add Club button.
- Select the club type you wish to add.
- To change the default club name, click on the top left number to bring up the keypad and enter a new name for your club.
- Click OK to save and select the new club for play.
Dashboard Options
- Add / Select Player (top left) - Click player name or cap icon to display the Player List menu.
- Add / Select Club (top center) - Click club name or club icon to display the Club list menu.
- RH / LH (top center) - Click the hand icon to select either Right Handed or Left Handed play.
- Navigation Arrows (top right) - Click the up/ down arrow keys to navigate between dashboards.
- System (bottom left) - Click to display the System Menu.
- Lessons (bottom left) - Click to display the Lessons Menu.
- 3Trak Light Indicator (bottom center):
- Green - System armed: Optimal ball placement.
- Yellow - System armed: More than one ball at tee area or not optimal ball placement.
- Red - System NOT armed, ball not placed in tee area.
- Estimated Spin (bottom center) - When the spin confidence for a shot is less than 50%, an e will display at the bottom center of all dashboards.
- Club Data (bottom center):
- On - Display club data - this is the default option.
- Note: The club speed displayed is the Measured Club Speed and requires a club sticker.
- Off (X) - Do not display club data.
- C - Display Calculated Club Speed (instead of Measured Club Speed) and exclude other club data on dashboard screens.
- Note: The Calculated Club Speed displayed does not require a club sticker.
- Login / Logout (bottom center right) - Click to log in or log out an aG Data (online) player.
- Upload (bottom center right) - If set to AUTO, shot data will automatically be uploaded to the server. If set to NO, no shot data will be uploaded. Note: This option will only be enabled when an online aG Data member is logged in.
- Dashboards (bottom right) - Click to select the Perform Pro dashboard you wish to navigate to.
Dashboard Options
3-Trak Screen
Shows all ball and club data from current shot. Options are:
- SAVE SAMPLE - Click to save shot data to send to aG Technical Support for review.
- < 3TRAK > - Cycle through actual ball images from the current shot.
- BALL IMAGES - Actual images of the golf ball after impact.
- Relevant information derived from the ball / club data the system uses to determine ball flight.
Set Units
At any Perform Pro dashboard, you may choose to toggle measurements between Imperial and Metric units by pressing the ‘u’ key. The ‘u’ key will allow you to cycle through five unit settings including:
- yards - mph
- meters - kph
- meters - m/s
- meters - mph
- yards - m/s
Dashboard Screens
Perform Pro dashboards display golfer shot data in various formats including data tables, graphs, and swing videos. Click the Dashboards button at the bottom left and choose from the following:
- Basic Dashboard
- Detail Dashboard
- Spin Dashboard
- Club Analysis Dashboard
- Evaluation Dashboard
- Optimizer Dashboard
- Ball Flight Dashboard
- Balance Dashboard - Displays aG Balance information when connected to the Balance plate. For more information regarding aG Balance, see the aG Balance Training Manual.
- Flix Dashboard - For more information regarding aG Flix, see the aG Flix Training Manual.
- Note: Your license key must include the aG Flix product to display this dashboard screen.
Dashboard Menu
Dashboard Screens
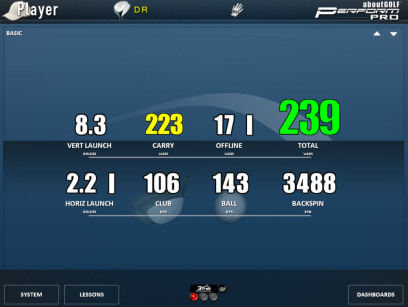 Basic Dashboard
- Vert Launch - Initial vertical launch angle of ball relative to ground.
- Carry - Distance the ball travels in air.
- Offline - Ball landing distance off-line relative to target line (‘r’ight or ‘l’eft).
- Total - Total shot distance including air, bounce and roll.
- Horiz Launch - Ball’s initial horizontal launch angle (‘r’ight or ‘l’eft).
- Club - Speed of center of clubface at impact.
- Ball - Ball speed at launch.
- Backspin - Ball’s rotation rate at impact.
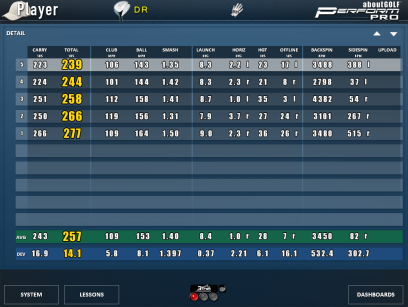 Detail Dashboard
- Carry - Distance the ball travels in air.
- Total - Total shot distance including air, bounce, and roll.
- Club - Speed of center of clubface at impact.
- Ball - Ball speed at launch.
- Smash - Ratio of ball speed to club speed, impact efficiency measure.
- Launch - Initial vertical launch angle of ball relative to ground.
- Horiz - Ball’s initial horizontal launch angle (‘r’ight or ‘l’eft).
- Hgt - Highest point of the air portion of shot.
- Offline - Ball landing distance off-line relative to target line (‘r’ight or ‘l’eft).
- Backspin - Ball’s rotation rate at impact.
- Sidespin - Ball’s horizontal spin rate at impact (‘r’ight or ‘l’eft).
- Upload - When an arrow displays next to a shot, clicking the arrow will upload the shot to the server if you are connected to the internet.
- AVG - The average of all shots taken.
- DEV - The standard deviation of all shots taken.
- Note: Measurements denoted with '--' are not included in the average or standard deviation calculations.
Dashboard Screens
Spin Dashboard
- Backspin - Ball’s rotation rate at impact.
- Sidespin - Ball’s horizontal spin rate at impact (‘r’ight or ‘l’eft).
- Riflespin - The barrel roll spin which is spinning clockwise/counter-clockwise down the line of flight.
- Total spin - The spin rate about the spin vector which includes the back, side and rifle spin components.
- Total - Total shot distance including air, bounce, and roll.
- Carry - Distance the ball travels in air.
- Club - Speed of center of clubface at impact.
- Ball - Ball speed at launch.
- Vert - Initial vertical launch angle of ball relative to ground.
- Horiz - Ball’s initial horizontal launch angle (‘r’ight or ‘l’eft).
- Offline - Ball landing distance off-line relative to target line (‘r’ight or ‘l’eft).
Dashboard Screens
Club Analysis Dashboard
Dashboard Screens
Club Analysis Dashboard
- Carry - Distance the ball travels in air.
- Total - Total shot distance including air, bounce, and roll.
- Ball Speed - Ball speed at launch.
- Club Speed - Speed of center of clubface at impact.
- Club Path - Horizontal angle the club head is moving at impact (‘i’n or ‘o’ut).
- Vert Attack - Vertical angle the club head is moving at impact.
- Offset - The measurement where the ball strikes the club face relative to the center of the club face. This is a horizontal measurement of hitting the ball on the heel or toe of the club.
- AVG - The average of all shots taken.
- DEV - The standard deviation of all shots taken.
- Note: Measurements denoted with '--' are not included in the average or standard deviation calculations.
- SwingScope Meter - The swing scope meter shows a graphical representation of the club strike direction, the club face angle at impact, and the ball direction for the shot selected in the table. The following values are displayed on the swing scope meter:
o Horiz Path - Horizontal angle the club head is moving at impact (‘i’n or ‘o’ut).
o Horiz Launch - Ball’s initial horizontal launch angle (‘r’ight or ‘l’eft).
o Club Speed - Speed of center of clubface at impact.
o Ball Speed - Ball speed at launch.
o Smash Factor - Ratio of ball speed to club speed, impact efficiency measure.
o Vert Attack - Vertical angle the club head is moving at impact.
o Vert Launch - Initial vertical launch angle of ball relative to ground.
o Avg/Dev - Click to turn on/off the Avg/Dev display on the swing scope meter.
How to Turn On/Off Club Data Collection:
Set the club data option at the bottom middle of any Perform Pro dashboard to display/exclude club data.
On - Display club data - this is the default option.
- Note: The club speed displayed is the Measured Club Speed and requires a club sticker.
- Off (X) - Do not display club data.
- C - Display Calculated Club Speed (instead of Measured Club Speed) and exclude other club data on dashboard screens.
- Note: The Calculated Club Speed displayed does not require a club sticker.
Dashboard Screens
Evaluation Dashboard
Data Along Top of Screen:
- Carry - Distance the ball travels in air.
- Club - Speed of center of clubface at impact.
- Ball - Ball speed at launch.
- Vert - Initial vertical launch angle of ball relative to ground.
- Horiz - Ball’s initial horizontal launch angle (‘r’ight or ‘l’eft).
- Backspin - Ball’s rotation rate at impact.
- Sidespin - - Ball’s horizontal spin rate at impact (‘r’ight or ‘l’eft).
- Offline - Ball landing distance off-line relative to target line (‘r’ight or ‘l’eft).
- Note: The bar graph at the top right indicates how many data items fall within the green areas of the gauge graphics (by displaying a green bar).
Gauge Data:
- Centeredness of Hit - The measurement where the ball strikes the club face relative to the center of the club face. This is a horizontal measurement of hitting the ball on the heel or toe of the club.
- Club Path - Horizontal angle the club head is moving at impact (‘r’ight or ‘l’eft).
- Face Angle - Clubface angle at impact (‘o’pen or ‘c’losed).
- Outside to in club path with open face will produce a fade or slice.
- Outside to in club path with closed face will produce a draw or hook.
- Angle of Attack - Vertical angle the club head is moving at impact.
- Smash Factor - Ratio of ball speed to club speed, impact efficiency measure.
- Current Shot/Average - Click to choose to display shot data for only the Current Shot or for the Average of all shots taken for the selected club.
- Note: You may select the yellow and red zones on the gauges to adjust the target areas depending on the golfer skill level. Click to select the yellow or red zone on the gauge and then drag it to adjust the skill level.
Dashboard Screens
Optimizer Dashboard
The Optimizer dashboard allows you to select up to 3 clubs to view and compare shot data for. At the upper left, the current club selected always displays in the first club position. The following information is displayed along the top of the screen:
- Total Shot Count (next to club name) - Total shots taken for club.
- Shot Data (next to shot count) - Data for the following categories are displayed:.
- Current Shot - The current shot data.
- Average Last - The average data of the last shots taken. (Note: Select the number of shots to include in this column by choosing the Optimize Last button at the bottom of the screen.)
- Optimum Last - The optimum data of the last shots taken. (Note: Select the number of shots to include in this column by choosing the Optimize Last button at the bottom of the screen.)
- For each Shot Data category, the following values display:
- Carry - Distance the ball travels in air.
- Ball - Ball speed at launch.
- Launch - Initial vertical launch angle of ball relative to ground.
- Spin - Ball’s rotation rate at impact.
Compare Club Data:
You may compare shot data for up to 3 clubs. Shot data for all clubs selected will display on the Optimizer Graph.
- Choose the Click to add button in the 2nd or 3rd club position at the top left of the screen to open the club menu.
- Double click or click select to select the club you wish to compare shot data to.
- To remove a club from the 2nd or 3rd position:
- Click the club you would like to remove.
- Choose Clear entry at the bottom of the club menu.
- The club will be removed from the screen.
Dashboard Screens
Optimizer Dashboard
The Optimizer dashboard also allows you to choose how many shots to include on the graph and how many shots to include in the Average Last and Optimum Last tables (at the top of the screen).
- At the middle right of the dashboard, click on the Graph button to toggle between the graph options of Average, Last, or All shots. The graph data will display depending on the clubs and the graph option selected. Each club selected will be graphed in a different color.
- To select the number of shots to include in the Average Last and Optimum Last data columns, click on the Optimize Last button and select from 3 to 20 shots. The number selected here will display at the top of the screen in the Average Last and Optimum Last column headings.
- You also have the option to delete shots from this dashboard:
- To delete the last shot taken, click on the Delete Last Shot button.
- To delete all shots for the player, click on the Delete All Shots button. This will delete all shots for all clubs for the player selected.
Dashboard Screens
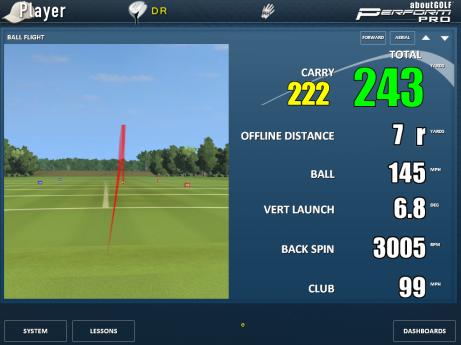 Ball Flight Dashboard
- Carry - Distance the ball travels in air.
- Total - Total shot distance including air, bounce, and roll.
- Offline Distance - Ball landing distance off-line relative to target line (‘r’ight or ‘l’eft).
- Ball - Ball speed at launch.
- Vert Launch - Initial vertical launch angle of ball relative to ground.
- Backspin - Ball’s rotation rate at impact.
- Club - Speed of center of clubface at impact.
From the Ball Flight dashboard, you have the option to replay your current shot in Forward or Aerial view.
Aerial View of Shot
Dashboard Screens
Balance Dashboard
- Integrated with 3Trak-powered aboutGOLF technology, the Balance dashboard provides world-class swing balance data for analysis and instruction.
- With dual force plate technology, Balance provides comprehensive data for evaluating player swing profiles, including the distribution of weight left to right and front to back for each foot.
- Balance data is presented in easy to understand visual graphics, as well as detailed data tables to support scientific analysis.
- All swing / balance data is time stamped and synchronized to the swing motion and instant of impact.
- Integrate with the Flix dashboard to provide time synchronized swing video for analysis side-by-side with Balance.
- Please refer to aG Balance Training Manual for additional information.
Balance Dashboard
Dashboard Screens
Balance Dashboard - Menu Options
To view Balance menu options, click the menu button at the lower left of the screen.
The following options are available:
- Eval - Click to go to the Balance Evaluate screen
- Static Balance - Click to go to the Static Balance screen
- Window Layout - Choose from 9 different window display views
- CoP Graph - Choose what to display on the Center of Pressure graph
- Force Chart - Choose what to display on the Force Chart
- Select Shot - Select the Balance shot data you wish to display on the screen
- Save Shot - Save your Balance shot
- Swing Markers - Display or hide swing markers on the playback scrollbar
Dashboard Screens
Balance Evaluate Screen
- The Balance Evaluate screen allows you to specify targets for various balance characteristics, and evaluate your performance against those targets.
- To go to the Balance Evaluate screen:
- Click the Menu button at the bottom left of the Balance dashboard
- Choose Eval
To receive the most benefit from the Balance Evaluate screen, footprints should exist, and swing markers for Address through Impact should be set for the shot being evaluated.
Dashboard Screens
Balance Evaluate Screen - Shot Selection
- The menu at the lower right of the screen displays shots containing balance data.
- By default, the shot that was displayed on the Balance dashboard will be selected at the Balance Evaluate screen.
- Any shot selected in this screen will be displayed when returning to the Balance dashboard.
- Above the shot menu is the Show Averages checkbox.
- When checked, the shot menu is disabled and averages of the shots are displayed in the gauges.
- Each gauge may use a different number of shots to calculate its average.
- For example, if 5 of 10 shots have the Address swing marker set, then 5 shots would be used for the average Address Left/Right gauge - but 10 shots would be used for the average Maximum Force gauge.
Balance Evaluate Screen - Selection of Gauge Sets
- The list of checkboxes at the top right of the Balance Evaluate screen allows up to 3 gauge sets to display.
- Each of the Swing Marker gauge sets presents the same balance characteristics at different points of the swing (including Address, Mid Backswing, Top of Swing, Mid Downswing, and Impact), while the swing data gauge set shows data related to the entire swing.
- At the top right of each gauge set frame is a set of colored indicators that reflect the number of green, yellow, and red gauges in the frame. The indicators show at a glance the state of the gauges in the frame.
Swing Marker Gauge Sets
- Each swing marker gauge set contains 5 gauges that can be used to evaluate the player’s Balance characteristics including:
- Address
- Mid Backswing
- Top of Swing
- Mid Downswing
- Impact
Dashboard Screens
Balance Evaluate Screen - Selection of Gauge Sets
Swing Marker Gauge Sets
- Left/Right weight distribution gauge:
- Located at the top of the gauge set, this gauge represents the distribution of the player’s weight between the left and right feet.
- To modify the target values for the gauge, position the cursor over a yellow or red region, click, hold and drag the region until the desired limit is achieved.
- Footprint gauges:
- Within the footprints, the gauges represent the Toe/Heel and Inside/Outside images on the Evaluate screen.
- Within the footprints, the vertical axis corresponds to the toe/heel gauge and the axis increments are every 10%.
- The horizontal axis indicates the distance from the foot center line with increments every .5 inch (1 cms).
- The footprints contain gauges for two balance characteristics.
- The distribution of pressure from toe to heel is represented by the numbers next to each foot, and by the vertical axis of the yellow and green regions inside the footprints.
- The horizontal axis of the yellow and green regions corresponds to the location of pressure, with respect to the center line of the foot, and is indicated below each foot as being either inside or outside the center line.
- To modify the target values for the gauges, position the cursor over a yellow or green region near one of the sides. Click, hold and drag the side of the region until the desired limit is achieved.
- Note: These gauges require that footprints exist for the swing.
Dashboard Screens
Balance Evaluate Screen - Selection of Gauge Sets
Swing Data Gauge Set
- The swing data gauge set contains up to 4 gauges.
- Display of the gauges is controlled with the checkboxes in the swing data gauge set frame/panel.
- The gauges that can be displayed are:
- Maximum Force - The maximum force generated by the player during the swing.
- as percent of Address - When selected, the maximum force gauge is displayed as a percentage of the force at Address. If Address is not set, the earliest swing marker is used, or if no swing markers are set, the start of the data is used.
- Maximum Force Time - The time relative to the ball strike of the maximum force. The gauge indicates whether the maximum occurred before or after impact.
- Tempo (duration) - The duration of the swing in seconds from address to impact. Requires that the Address swing marker be set.
- Tempo (ratio) - The ratio of the backswing time to the downswing time. Requires that the Address and Top of Swing markers be set.
Dashboard Screens
Game Set Reset
Click the Reset button to restore the gauge targets to their original values.
- Single Click - A single click on the Reset button will restore the values to the player’s saved target values.
- The player’s target values are saved when the Return to Balance button is clicked.
- The targets are saved in the player’s folder in the file: BalanceEvalSettings.xml.
- Double Click - A double click on the Reset button will restore values appropriate for the player’s ability level.
- The player’s ability level can be set the first time Reset is double clicked.
- Balance Evaluate uses the player ability to determine the default target values for the gauges.
- There are 3 levels of ability:
- Professional
- Amateur
- Beginner
BalanceEvalSettings.xml File
- The BalanceEvalSettings.xml file stores the target values for the gauges and the states of the checkboxes.
- When a player enters the Balance Evaluate screen, the BalanceEvalSettings.xml file is used to initialize the values.
- When a player chooses Return to Balance, the target values and checkbox settings are saved to the file in the player’s folder.
- The following files in the World Tours Golf folder contain target values for the gauges appropriate to the ability level of the player. Once the player’s ability has been set, these files are used to Reset the target values on the Balance Evaluate screen.
- BalanceEvalSettingsProfessional.xml
- BalanceEvalSettingsAmateur.xml
- BalanceEvalSettingsBeginner.xml
Dashboard Screens
Static Balance Screen
- Static Balance uses the dual force plate system to record a user’s center of pressure while quiet standing.
- The user’s center of pressure is compared to their ideal center of pressure; the dominant direction of oscillation is indicated and posture characteristics are calculated in the anterior-posterior (A-P) and medio-lateral (M-L) directions.
- The recording can be played back, printed and saved for later review.
Dashboard Screens
Collecting a Static Balance Sample:
- Click on the Static Balance button at the lower left of the Balance dashboard.
- Click Set Duration to specify the duration of the sample and indicate whether the user is wearing shoes.
- The duration must be between 1 and 60 seconds and defaults to 52 seconds.
- Position the user on the force plates with the feet side-by-side; each foot on its own plate.
- Click the Start button. Note: If the process must be aborted, click the Cancel button at any time.
- Have the user create footprints.
- The user should slowly and gently rock from their heels to the balls of their feet several times.
- The foot should not rise off the plate more than .5 inches (1.5 cm) as the user rocks.
- After several seconds of rocking, the user’s footprints will appear on the screen and a countdown to quiet standing will begin.
- The footprints will be centered on the screen regardless of where the user stands on the force plates.
- During sample collection, the sample will be displayed in real time.
- Collection continues until the specified duration has been reached or Cancel is clicked.
- After the sample has been collected, the screen interface switches to review mode.
Reviewing a Static Balance Sample:
- In review mode, Static Balance samples can be played back using the playback controls.
- Available options are:
- Play
- Pause
- Stop
- Frame-by-Frame advance
- Reverse
- Dragging the playback slider to the desired location
Dashboard Screens
Reviewing a Static Balance Sample:
- The sample time being displayed is indicated at the upper left of the frame.
- Average values are not displayed until at least 1 second of the sample has elapsed.
- The display can be zoomed 2x and 4x by repeatedly clicking the Zoom In button.
- Zoom Out reverses the Zoom In.
Static Balance Sample
Dashboard Screens
Reviewing a Static Balance Sample:
Graphic Features
- The midpoint of the grey line connecting the footprints is the ideal center of pressure - indicated by a small circle.
- The user’s current center of pressure is indicated with a cyan diamond.
- The path of the center of pressure is a yellow line.
- The user’s average center pressure is indicated with a magenta diamond.
- The magenta lines extending from the average center of pressure indicate the dominant direction of oscillation, with the angle value (Left or Right) indicated.
- The distance between the average and ideal centers of pressure is indicated with a green line. These distance values are displayed at the lower right of the frame.
- The distance spanned by the center of pressure track in the A-P and M-L directions is shown at the lower left. The Standard Deviation of the distance is also indicated.
- The calculated length of the foot based on the user’s rocking motion to create footprints is shown to the side of each foot. Adjust the user’s rocking technique to produce more accurate results.
- The percentage of total pressure applied to each foot is displayed below each foot.
- The percentage of pressure applied to each toe and heel is displayed to the inside of each foot.
- When the sample has been loaded from a file, the file name is displayed in the upper right of the frame.
- A background grid with 1 inch spacing (1 cm in metric).
Saving and Loading Samples:
- The Load Sample button displays a list of the Static Balance files in the current player’s StaticBalance folder.
- Select a sample to load and click OK.
- The Save Sample button is only available after a sample has been collected.
- The default file name for the saved sample is: ‘YYYY_MM_DD_hh-mm-sec’ and can be modified.
- The samples are stored in a folder named StaticBalance under the player’s folder.
- Only one sample may be loaded at a time.
- Loading a sample will replace any existing sample.
- Collecting a sample will also replace any existing sample.
Dashboard Screens
Flix Dashboard
- The Flix dashboard allows you to record and replay videos captured at Perform Pro and also to view existing saved shot and pro videos.
- The Lessons Manager can be accessed from any Perform dashboard and allows you to replay your lessons, e-mail lessons, save previously recorded lessons to CD, or upload lessons to the aG Data website.
- My Swings Manager allows you to e-mail shot videos, or save shot videos to an external usb/flash drive.
- Flix can support up to 5 cameras. Note: You must have at least one camera hooked up and enabled to capture shot video.
- Please refer to aG Flix Training Manual for additional information.
Flix Options
- aG Flix Toolbar Menu icon - Click to display the aG Flix Menus including:
- Save Shot to My Swings - Save all swing videos for the current shot to My Swings Manager.
- My Swings Manager - Manage saved shot swing videos and live recording videos.
- Snap to Impact - Click to turn on/off. When on, all current shots will be repositioned near the point of impact.
- Add Window - A maximum of five windows can be displayed at one time.
- Cameras Setup - Setup your cameras including resolution, frame rate, shutter speed and brightness.
- Flix Enabled - Turn on/off Flix cameras to capture shot videos.
- Live View - Click the camera icon to turn on/off live view mode.
- Playback Speed - Click to choose the speed to play back videos including:
- 1x - Playback in normal speed.
- 1/2x - Playback in half of normal speed.
- 1/4x - Playback in one fourth of normal speed.
- 1/8x - Playback in one eighth of normal speed.
- 1/16x - Playback in one sixteenth of normal speed.
- 2x - Playback twice as fast as normal speed.
- Playback Controls - Play, Pause/Stop, Advance by Frame Reverse, Move slider to desired Frame, Advance by Frame Forward.
- You also have the option move your video forward or reverse by using the right/left arrow keys.
- Note: When not in use, the entire Filx toolbar will fade out to increase the visibility of videos displayed.
Dashboard Screens
Flix Dashboard
Flix Dashboard
System Menu
- Balance Setup - Balance setup.
- Setup - 3Trak Mobile/Studio setup.
- About - Displays the Perform Pro version and other information.
- Help - Displays Perform Pro help.
- Desktop - Minimizes Perform Pro to your desktop.
- Save Last Shot - Save your last shot taken.
- Print - Print the currently displayed dashboard screen information.
- Update License - Update your license information.
- Current Mode: All Shots / Today’s Shots - Select how to display shot data on Perform Pro dashboards and reports.
- All Shots option - All shot data and averages for all days will display for the current player.
- Today’s Shots option - Only shot data and averages for today will display for the current player.
- Quit - Exit Perform Pro.
- Add Balance To Report - This option only displays when at the Balance dashboard. Choose this option to add the current saved shot or a previously saved shot to the report, after selecting and setting the key swing marker positions. Note: Select a previously saved shot by clicking on the Select Shot button at the right of the Balance screen.
- Add Screen to Report - Add the current screen to the Perform Pro report.
- Report Editor - Opens the Report Editor screen. See Appendix B - Report Editor for more details.
- Passwords - Password protect Perform Pro options.
- If Administrator is enabled, the following options will require a password:
- Balance Setup, 3Trak Setup, Help, Desktop, Update License, Flix / Cameras Setup, Quit
- If Printing is enabled, you will be required to enter a password before printing.
System Menu
System Menu
Report Editor
- From the Report Editor screen you have the ability to edit, add and delete the items you wish to include on your report, and also to import previous reports for your golfer or for another golfer.
- The data that displays on the report is based on the option you have selected for the Current Mode: either All Shots or Today’s Shots.
- If the Current Mode = All Shots, all shot data for all days will display on the report for the current player.
- If the Current Mode = Today’s Shots, only shot data for shots taken on that day will display on the report for the current player.
- Balance sequence shots/screens will display on the report if the Add Balance to Report option has been selected.
- When two or more balance sequences exist on the report, you have the option to link two sequences together by selecting ON for the Before After Link option.
- When two balance sequences have been linked together, they will display side by side on the report. Each swing marker that has been set for the balance shot will display on the report.
- Screen shots will display on the report if the Add Screen to Report option has been selected.
- To create your report, click the Create Report button at the bottom left of the Report Editor screen.
Shut Down
- To exit Perform Pro Software:
- Click on the System button at the bottom left of any Perform Pro dashboard.
- Choose Quit and answer Yes to the Exit message.
- You will see the message: “Shutdown under way. Please wait before turning off the computer.”
- Once this message goes away and you exit to the Windows desktop, it is safe to turn off your computer.
- To shut down PC:
- Click on the Windows Start menu at the bottom left of your desktop.
- Select Shut Down.
- To Turn Off Projector(s):
- Aim projector remote control at front of projector.
- Press Power Button.
- Press Power Button again to confirm shut down.
Important Note: It is critical to wait for the Perform Pro Software to fully exit to the Windows desktop before attempting to turn off the computer. Otherwise, there is a risk your installation may become corrupted.
Shut Down
Click System at bottom left Choose Quit
Answer Yes to Exit message and wait before turning of your computer
Appendix A - Club Data
Integrated with the aboutGOLF 3Trak technology, measured club head data applies the same level of accuracy for ball tracking to the club head.
- When Club Data Mode is on, you will see the following Club data:
- Club Speed (at various Perform Pro dashboards)
- Club Path (at the Club Analysis and Evaluation dashboard)
- Vertical Attack (at the Club Analysis and Evaluation dashboard)
- Centered (at the Club Analysis and Evaluation dashboard)
- Smash (at the Detail and Evaluation dashboard)
Set Club Data Mode
- Set the club data mode at the bottom middle of any dashboard by clicking on the club icon.
- The Measured Club Speed and other club data will display when club data mode = On.
- Note: The Measured Club Speed requires a club sticker.
- If Club Data Mode = C, the Calculated Club Speed will display but other club data will not display.
- Note: The Calculated Club Speed does not require a club sticker.
- If Club Data Mode is Off (X), no club head data will display.
Club Preparation
In order for the 3Trak technology to track the club head, it is necessary to apply the provided club head stickers to the golf clubs.
Appendix A - Club Data
Irons
Apply a club head sticker to the top surface of the iron, centered. The technology needs to see the club head sticker from the top.
Woods
Apply a club head sticker to the top surface of the wood, centered. The technology needs to see the club head sticker from the top.
Appendix A - Club Data
White or Reflective Woods
It is necessary to use the larger, black club head stickers when the club head is white in color, or composed of a metallic or reflective material.
Appendix A - Club Data
After taking a shot at the Range, select the club analysis tab at the top of the Range post shot screen.
Club Analysis Club Data
- Club Data Table (from left to right):
- Carry - Distance the ball travels in air.
- Total - Total shot distance including air, bounce and roll.
- Ball Speed - Ball speed at launch.
- Club Speed - Speed of center of clubface at impact.
- Club Path - Horizontal angle the club head is moving at impact (‘i’n or ‘o’ut).
- Vert Attack - Vertical angle the club head is moving at impact.
- Offset - The measurement where the ball strikes the clubface relative to the center of the clubface.
- AVG - Average data for all shots in the table.
- DEV - Standard deviation for all shots in the table.
- Note: Measurements denoted with '--' are not included in the average or standard deviation calculations.
- SwingScope Meter - The swing scope meter shows a graphical representation of the club strike direction, the club face angle at impact, and the ball direction for the shot selected in the table. The following values are displayed on the swing scope meter:
- Horiz Path - Horizontal angle the club head is moving at impact (‘i’n or ‘o’ut).
- Horiz Launch - Ball’s initial horizontal launch angle (‘r’ight or ‘l’eft).
- Club Speed - Speed of center of clubface at impact.
- Ball Speed - Ball speed at launch.
- Smash Factor - Ratio of ball speed to club speed, impact efficiency measure.
- Vert Attack - Vertical angle the club head is moving at impact.
- Vert Launch - Initial vertical launch angle of ball relative to ground.
- Avg/Dev - Click to turn on/off the Avg/Dev display on the swing scope meter.
Appendix B - Report Editor
Perform Pro reports contain information about a player’s instruction or training session. Reports can display any of the following:
- Tables of club data
- Optional screen grabs
- Sequential Balance screen grabs of key points in the swing as added by the instructor
- The report is created in both a HTML and PDF formatted file.
- The PDF report file contains all the report content in one document for ease of emailing and copying.
- The HTML file is also available and can be viewed and printed from your default web browser, such as Internet Explorer, if you were to have problems viewing the PDF file.
- View the HTML report at the following folder:
- World Tours Golf/Members/<Member Name>/Reports/<Report Date>
There are three steps to creating a report:
- First, add screen grabs and/or balance sequences via the Perform Pro System menu.
- Next, click on the Report Editor option from the System menu to display the Report Editor screen.
- Finally, add the player information, any additional notes, and any previously run report items to the report.
- You may also re-order any of the report items until you achieve the desired report format.
- Click the Create Report button at the lower left of the Report Editor screen to create the report.
- The report file will first be created in HTML format and then be converted to PDF format. The PDF formatted report will immediately be displayed on the screen to view.
Appendix B - Report Editor
How to Add General Screen Grabs to Report:
- Add screen grabs by clicking the Add Screen to Report button from the System menu.
- The Perform Pro screen that is currently displayed will be added to the report.
- There is no limit to the number of screen grabs that can be added to the report.
- All screen grabs created that day will be included in the report.
Appendix B - Report Editor
Add Balance Screen Grabs / Sequences of Key Marker Points:
- This option is only available when at the Balance screen.
- The shot must be saved at the Balance screen before it can be added to the report.
- The instructor should first make sure that the desired key swing marker positions are manually set at the time of the shot before clicking the save button (the floppy disk button to the left of the playback toolbar).
- Once the shot has been saved, it can then be selected and added to the report at any time.
- To set key swing marker positions for the shot before saving, click the Swing Markers button to the left of the playback toolbar.
- When all desired key swing marker positions are set and the shot has been saved, clicking the Add Balance to Report button from the System menu. This will automatically update the screen to the right point in the swing for the Balance and/or Flix video displayed on the screen.
- Screen grabs will be created and added to the report for each swing marker location set.
- Multiple balance sequences can also be included on the report.
- The Report Editor allows two balance sequences to be linked together to form a before and after balance sequence pair.
Add Balance Sequence to Report
Appendix B - Report Editor
Report Editor Screen
- To open the Report Editor screen, choose Report Editor from the System menu.
- The Report Editor screen is where you format your report by:
- Adding player information
- Adding notes
- Adding previously run report items
- You may also re-order or exclude any report items until you achieve the desired report format.
- Once your report has been formatted, click the Create Report button at the lower left of the screen.
- Your report will be created and display in PDF format to view.
The Report Editor screen is made up of sections that will display on your final report. You have the option to order report item sections and to update, include or exclude items on the Report Editor screen.
Appendix B - Report Editor
Report Editor Options
- The Report Editor screen allows you to edit, delete, and reorder items in the report. All items on the report are displayed as a scrollable list.
- IN RPT (Include in Report checkboxes) - Select or unselect to include or exclude an item in your report.
- UP/DOWN (Order arrow keys) - To change the order of a report item, choose the UP or DOWN arrow keys. The report items will be displayed on the report in the same order they display on the Report Editor screen.
- Edit - Edit all fields in the Basics and Golfer Review report blocks.
- For all other report blocks, you have the option to enter notes when choosing Edit.
- When entering notes, you will first be prompted to enter a note title. For Example: Instructor Notes.
- After clicking OK at the note title menu, the notes menu will display allowing you to add notes to your report.
- Delete - Choose Delete to remove that item from the report.
- If the report item is a screen grab or balance sequence, the associated screen grabs will be deleted as well.
- If you are unsure whether to display an item on your report, choose to exclude the item (uncheck the Include in Report option) rather than delete it.
Appendix B - Report Editor
Balance Sequences - Before After Link
- When two or more Balance sequences have been added to your report, and are in sequential order on the Report Editor screen, a Before After Link option will display.
- If the Before After Link option is ON (default is OFF), the two balance sequences will display side by side on the report for each swing marker set.
- If one shot sequence has a swing marker set, and the other does not, only one balance sequence will display on the report for that swing marker.
- The two linked balance sequences will move together on the Report Editor screen if the up or down arrow is clicked to change the order display of the report.
- The linked Balance sequences will allow the golfer to compare their improvements from the instruction received in that session, to past sessions.
Appendix B - Report Editor
Add Report Items
- Click the Add Report Item button at the bottom center of the Report Editor screen to bring up the Add Report Item menu.
- The following section types can be added to the report:
- Basic Info
- Golfer Review
- Club Averages
- Club Compare
- Session Compare
- Gap Analysis
- Note
- You may include multiple Note sections throughout the report, however all other report section types may only be added to the report once.
- Screen grabs, balance sequences, and notes may all have multiple instances included on the report.
Appendix B - Report Editor
Import Old Report
- The Import Old Report option will allow notes, screen grabs, and balance sequences (linked or unlinked) to be imported from reports generated, for the current golfer, from prior shot dates.
- This option will also allow report items from other golfers to be included on the report.
- Report sections imported from other golfers will include the golfer name appended to the report section title (which is editable).
How to Import Old Reports
- Click the Import Old Report button at the bottom center of the Report Editor screen.
- Select the report you wish to import and click on Import Old Report.
- The report items from the selected report will now display on the Report Editor screen and will be included on your report when the Create Report button is chosen.
Appendix B - Report Editor
Report Editor Sections
- The first time you enter the Report Editor screen for a golfer, all of the sections types are automatically displayed. Note: The screen grab and balance sequence sections will only display if these options have been previously selected.
- If you do not want a specific section included on the report, it can be excluded or deleted from the report.
- Each of the section report items can be added to the report by clicking the Add Report Item button at the bottom center of the Report Editor screen.
- Except for notes, all other report sections can only be included on the report once.
- Screen grabs, balance sequences, and notes may all have multiple instances included on the report.
- The following sections can be included on the report:
- Basics
- Golfer Review
- Club Averages
- Club Compare
- Session Compare
- Gap Analysis Table
- Notes sections
- Screen Grabs
- Before After Links for Balance Sequence
Appendix B - Report Editor
Basics Section
The following report information is included in the Basics Section:
- Golfer Name
- Pro/Instructor name
- Date
- Email address
- Address
- Phone number
- To edit or add information in this section, click Edit.
- The Golfer Name will default to the name of the player currently selected, and the Date will default to Today’s date.
- Note: All fields in the Basics Section are optional.
Appendix B - Report Editor
Golfer Review Section
The following report information is included in the Golfer Review Section:
- Handicap
- Golf and Practice Frequency
- Strongest Part(s) of Game
- Weakest Part(s) of Game
- Home Course
- Goals of This Evaluation (Accuracy, Consistency, Power)
- To edit or add information in this section, click Edit.
- Note: All fields in the Golfer Review Section are optional.
Appendix B - Report Editor
Club Averages/Club Data Section:
- The Club Averages/Club Data section displays data for each club with shots.
- The Club Averages table includes the average, deviation and optimal data for the following values:
- Smash - Ratio of ball speed to club speed, impact efficiency measure.
- Ball - Ball speed at launch.
- Club - Speed of center of clubface at impact.
- Total - Total shot distance including air, bounce and roll.
- Carry - Distance the ball travels in air.
- Backspin - Ball’s rotation rate at impact.
- Sidespin - Ball’s horizontal spin rate at impact (‘r’ight and ‘l’eft).
- Vert - Initial vertical launch angle of ball relative to ground.
- Horiz - Ball’s initial horizontal launch angle (‘r’ight or ‘l’eft).
- Offline - Ball landing distance off-line relative to target line (‘r’ight or ‘l’eft).
- The Club Data table includes the average and deviation data for the following values:
- Club - Speed of center of clubface at impact.
- Smash - Ratio of ball speed to club speed, impact efficiency measure.
- Club Path - Horizontal angle the club head is moving at impact (‘r’ight or ‘l’eft).
- Attack - Vertical angle the club head is moving at impact.
- Centered - The measurement where the ball strikes the clubface relative to the center of the clubface.
- Max Height - Highest point of the air portion of shot.
- Offline - Ball landing distance off-line relative to target line (‘r’ight or ‘l’eft).
- Note: The top and side view graphs are displayed under the club data table.
Club Averages - Optimal Data:
- The optimal data values include the following shot data:
- Ball - Ball speed at launch, Carry - Distance the ball travels in air, Backspin - Ball’s rotation rate at impact, and Vert - Initial vertical launch angle of ball relative to ground.
- The Optimal average data displayed is generated based on the Current Mode setting.
- The Current Mode option is set at the Systems menu. Options are:
- All Shots - Include all shot data for all sessions.
- Current Mode: Today’s Shots - Include shot data for the current day only.
- The optimal data values on the report are for the average data based on the Current Mode setting and may not match the data values displayed on the Perform Pro Optimizer screen.
- The Optimizer screen displays data based on the last X number of shots hit.
- If the last X number of shots set on the Optimizer screen does not match the actual shots selected for the report, (based on the Current Mode setting), the report and Optimizer screen data values will not match.
- The report does NOT support the concept of only optimizing the last X shots.
Appendix B - Report Editor
Appendix B - Report Editor
Club Compare Section
This section of the report displays the averages of shot data for any clubs of the same type.
- If a golfer hit shots using three different driver clubs and four different 6 irons, the Club Compare section will display a table and graph to compare the three driver clubs (named Driver Club Compare), and a table and graph to compare the four 6 iron clubs (named 6 Iron Club Compare).
- Each compared club will display in a different color on the graph.
- This section will not display on the report if the golfer only has shots for one club type.
Appendix B - Report Editor
Session Compare Section
This section of the report allows the golfer to compare results for shots hit on more than one day.
- In the Report Editor screen for the Session Compare Block item, choose the dates you wish to compare shot data for by clicking on the Date 1 and Date 2 list boxes. The list boxes will display only the dates that have shots taken.
- The Session Compare section displays the averages of shot data for each club that has shots for the dates selected.
- Shots for Date 1 will be graphed in one color and shots for Date 2 will be graphed in another color.
- A separate Session Compare table and graph will be displayed on the report for each club.
Appendix B - Report Editor
Gap Analysis Section
The Gap Analysis section on the report presents the average data for each club with shots. This allows the pro/instructor to provide feedback on how well the golfer’s clubs are spaced, in terms of distance hit.
Notes Section
If notes have been included in the Notes section of the Report Editor screen, notes will display on the report.
- You may include multiple note sections throughout the report by clicking the Add Report Item button and choosing Add Note.
- You also have the option to include a title for your notes section.
- When adding or editing a note, you will be prompted to enter a title before entering your note information.
Appendix B - Report Editor
Screen Grabs Section
To include screen grabs on your report, click the Add Screen to Report button from the System menu at any dashboard.
- The Perform Pro screen that is currently displayed will be added to the report and will display at the Report Editor screen.
- You can add as many screen grabs to your report as you like.
- All screen grabs created that day will be included in the report.
Appendix B - Report Editor
Balance Sequence Section
- When you are at the Balance dashboard, you will be able to add balance sequences to your report by clicking the Add Balance to Report button from the System menu.
- Multiple Balance sequences can be included on the report.
Appendix B - Report Editor
Create Report
After you have finished formatting your report layout, click the Create Report button at the bottom left of the screen to create your report.
- The game will process your report information, then minimize and display your report in PDF format.
- The report will display each report section in the same order as selected on the Report Editor screen - and will exclude any sections you have not selected.
- Any balance sequences that have the Before After Link set to ON will display the linked sequences, for each swing marked selected, side by side on the report.
Report Layout
- Report Logo:
- The report first displays a logo.
- This logo is defined by the ReportHeader.html and ReportHeader.gif files in the World Tours Golf directory, and can be customized.
- The default report logo (in the ReportHeader.gif file) contains an aboutGOLF Perform Pro logo.
- Report Title:
- Following the logo, the report title “aboutGOLF Perform Pro Session Report” is displayed.
- You may edit the title in the ReportHeader.html file in the World Tours Golf directory.
- Report Body:
- The report body can contain any of the following sections. Choose the sections you wish to display in the order you wish to display them on the Report Editor screen.
- Report Body Sections:
- Basics
- Golfer Review
- Club Averages
- Club Compare
- Session Compare
- Gap Analysis Table
- Notes
- Screen Grabs
- Before After Links for Balance Sequence
Appendix B - Report Editor
Display Shots - Today’s Shots or All Shots
When generating your Perform Pro report, you have the option to display the report for All Shots or only Today’s Shots.
- Choose the System button and click the Shot Mode button to toggle between:
- Today’s Shots - Include shot data for today only.
- All Shots - Include all shot data for all sessions.
- If a player has a total of 10 driver shots, but only 5 shots have been hit that day, the report will be created as follows:
- Today’s Shots - Only 5 shots will be included in the average for the driver.
- All Shots - All 10 shots will be included in the average for the driver.
- Note: All shots taken today will be included in the report even if there were multiple or separate sessions that day.
Today’s shots will display on report and screens
Appendix B - Report Editor
Units Displayed
Perform Pro reports support the ability to display the data in different units. At any Perform Pro screen, change the units by clicking the ‘u’ key. The ‘u’ key will allow you to cycle through five unit settings, including:
- yards - mph
- meters - kph
- meters - m/s
- meters - mph
- yards - m/s
Whatever units have been set when the Create Report button is selected will be the units displayed for the club data in the report.
Note: Any screen grabs will display in the units that were set when the Add Screen to Report option was selected.